What It Is
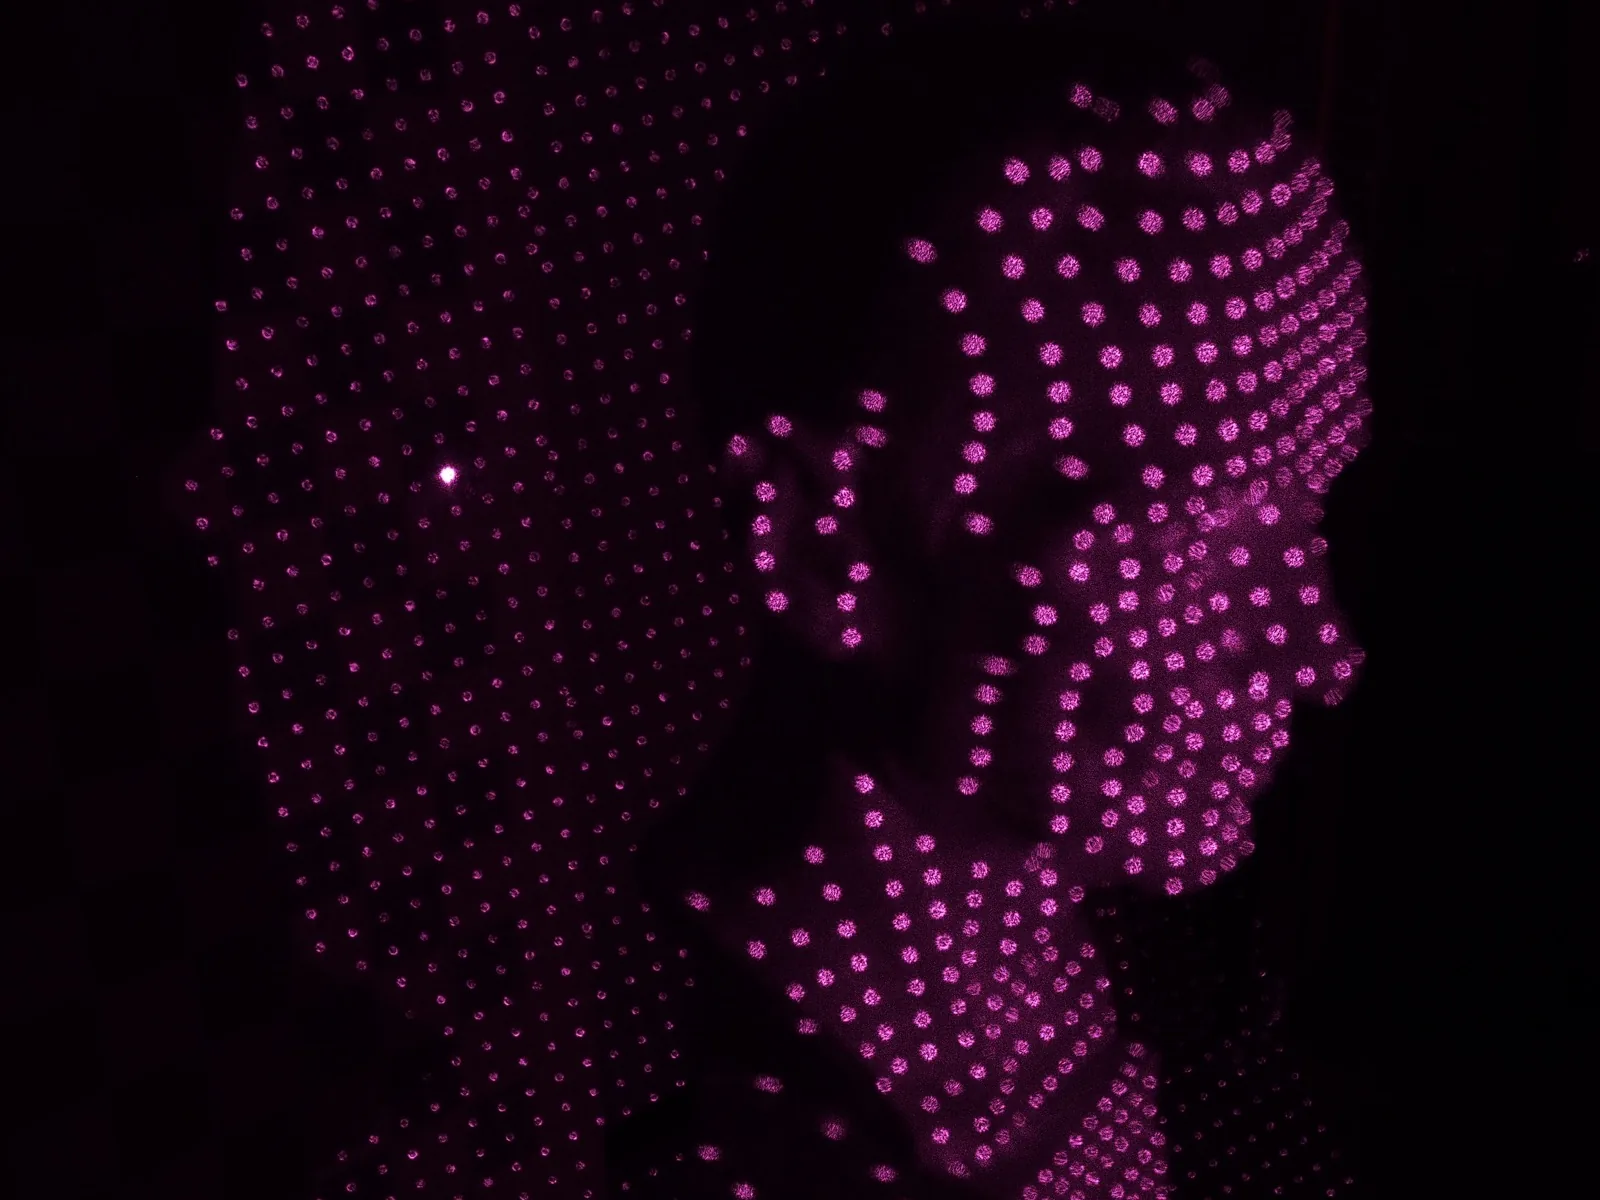
Imagine touching a probe to thousands of spots on an object and writing down the 3D coordinate of each touch. Do that millions of times, very quickly, and the dots together trace out the object’s shape. That is a point cloud: not a solid surface, but a dense sampling of points on the surface. Step back far enough and the gaps disappear — the cloud looks like the real thing.
Crucially, a point cloud is measured data, not a drawing. Every point came from a real observation, so a good cloud is an accurate, scalable record of how something actually was at the moment of capture.
Inside a Single Point
At minimum each point carries its position — X, Y, Z. Most clouds carry more:
- Intensity — how strongly a LiDAR pulse reflected, hinting at the surface material (see What is LiDAR?).
- Color (RGB) — real-world color, either from the laser’s own returns or draped from photographs.
- Classification — a label such as ground, building, vegetation, or wire, assigned during processing.
- Return number — for LiDAR, whether this was a first, intermediate, or last return of its pulse.
- GPS time / source — when and by which sensor pass the point was captured.
These extra channels are what make a cloud useful rather than just pretty: classification lets you isolate the bare earth, intensity lets you read lane lines, and color makes the scene legible to a human.
Where They Come From
LiDAR
- Direct laser measurement
- Works in the dark
- Penetrates vegetation
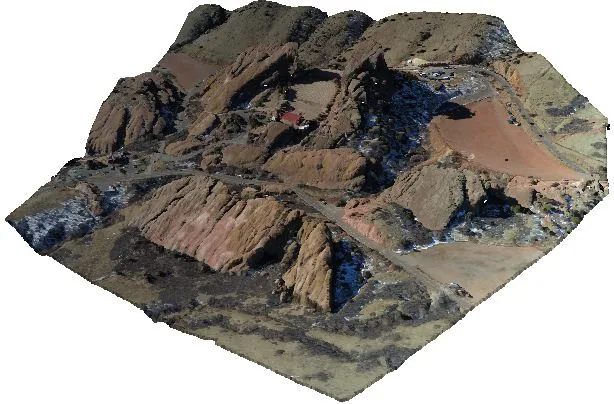
Photogrammetry
- Computed from photos
- True photo color
- Low equipment cost
Depth sensors
- Stereo & structured light
- Real-time, close range
- Robotics & scanning apps
Whatever the source, the result lands in the same format and tooling — which is exactly why the point cloud is the lingua franca of 3D capture. For how the two main sources differ in practice, see LiDAR vs Photogrammetry.
Registration & Georeferencing
A single scan only covers what one sensor saw from one place. Real projects combine many scans, and two steps make that possible:
- Registration — aligning multiple overlapping clouds into one consistent model, by matching shared features or common targets so the seams line up.
- Georeferencing — placing that combined cloud at its correct real-world location and orientation, using GNSS control or known ground points, in a chosen coordinate system.
Common Formats
- LAS / LAZ — the industry-standard format for LiDAR (LAZ is the compressed version). Carries position, intensity, classification, returns, and GPS time.
- E57 — a vendor-neutral format common for terrestrial scan data, able to hold imagery alongside points.
- PLY / PTS / XYZ — simpler, widely-supported formats often used for photogrammetric and general clouds.
Because clouds get huge, storage and streaming formats (tiled and octree-based schemes) are increasingly used so software can show a billion-point dataset without loading it all at once.
From Cloud to Deliverable
A point cloud is usually the start, not the end. From it you can derive:
- Meshes & surfaces — connecting points into a continuous skin for modeling and visualization.
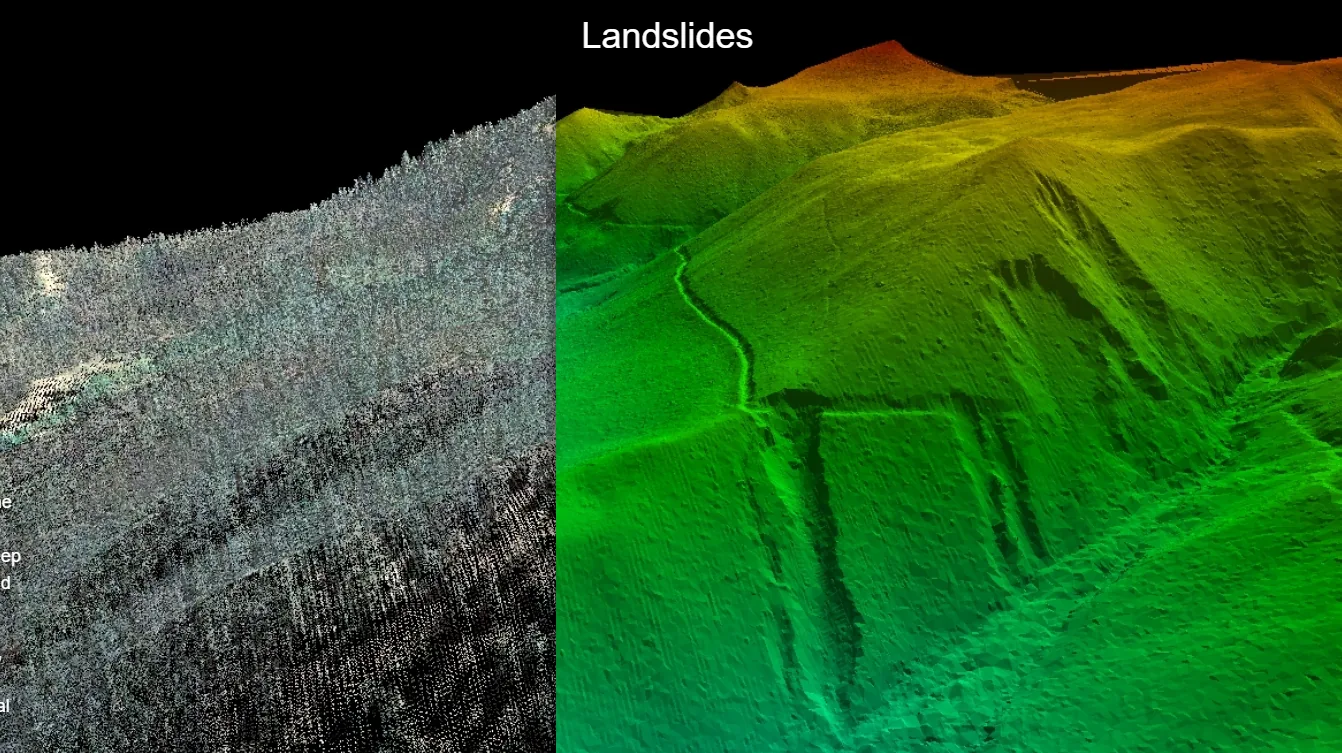
- Terrain models — filtering to ground points to build a DTM, or keeping everything for a DSM.
- CAD & BIM — fitting planes, pipes, and components to the points for as-built engineering models.
- Measurements & analysis — distances, areas, volumes, clearances, deformation over time, and change detection.
Master the point cloud and the rest of reality capture falls into place — every model, map, and measurement traces back to those millions of measured points. See how they are captured in What is LiDAR? and What is Photogrammetry?