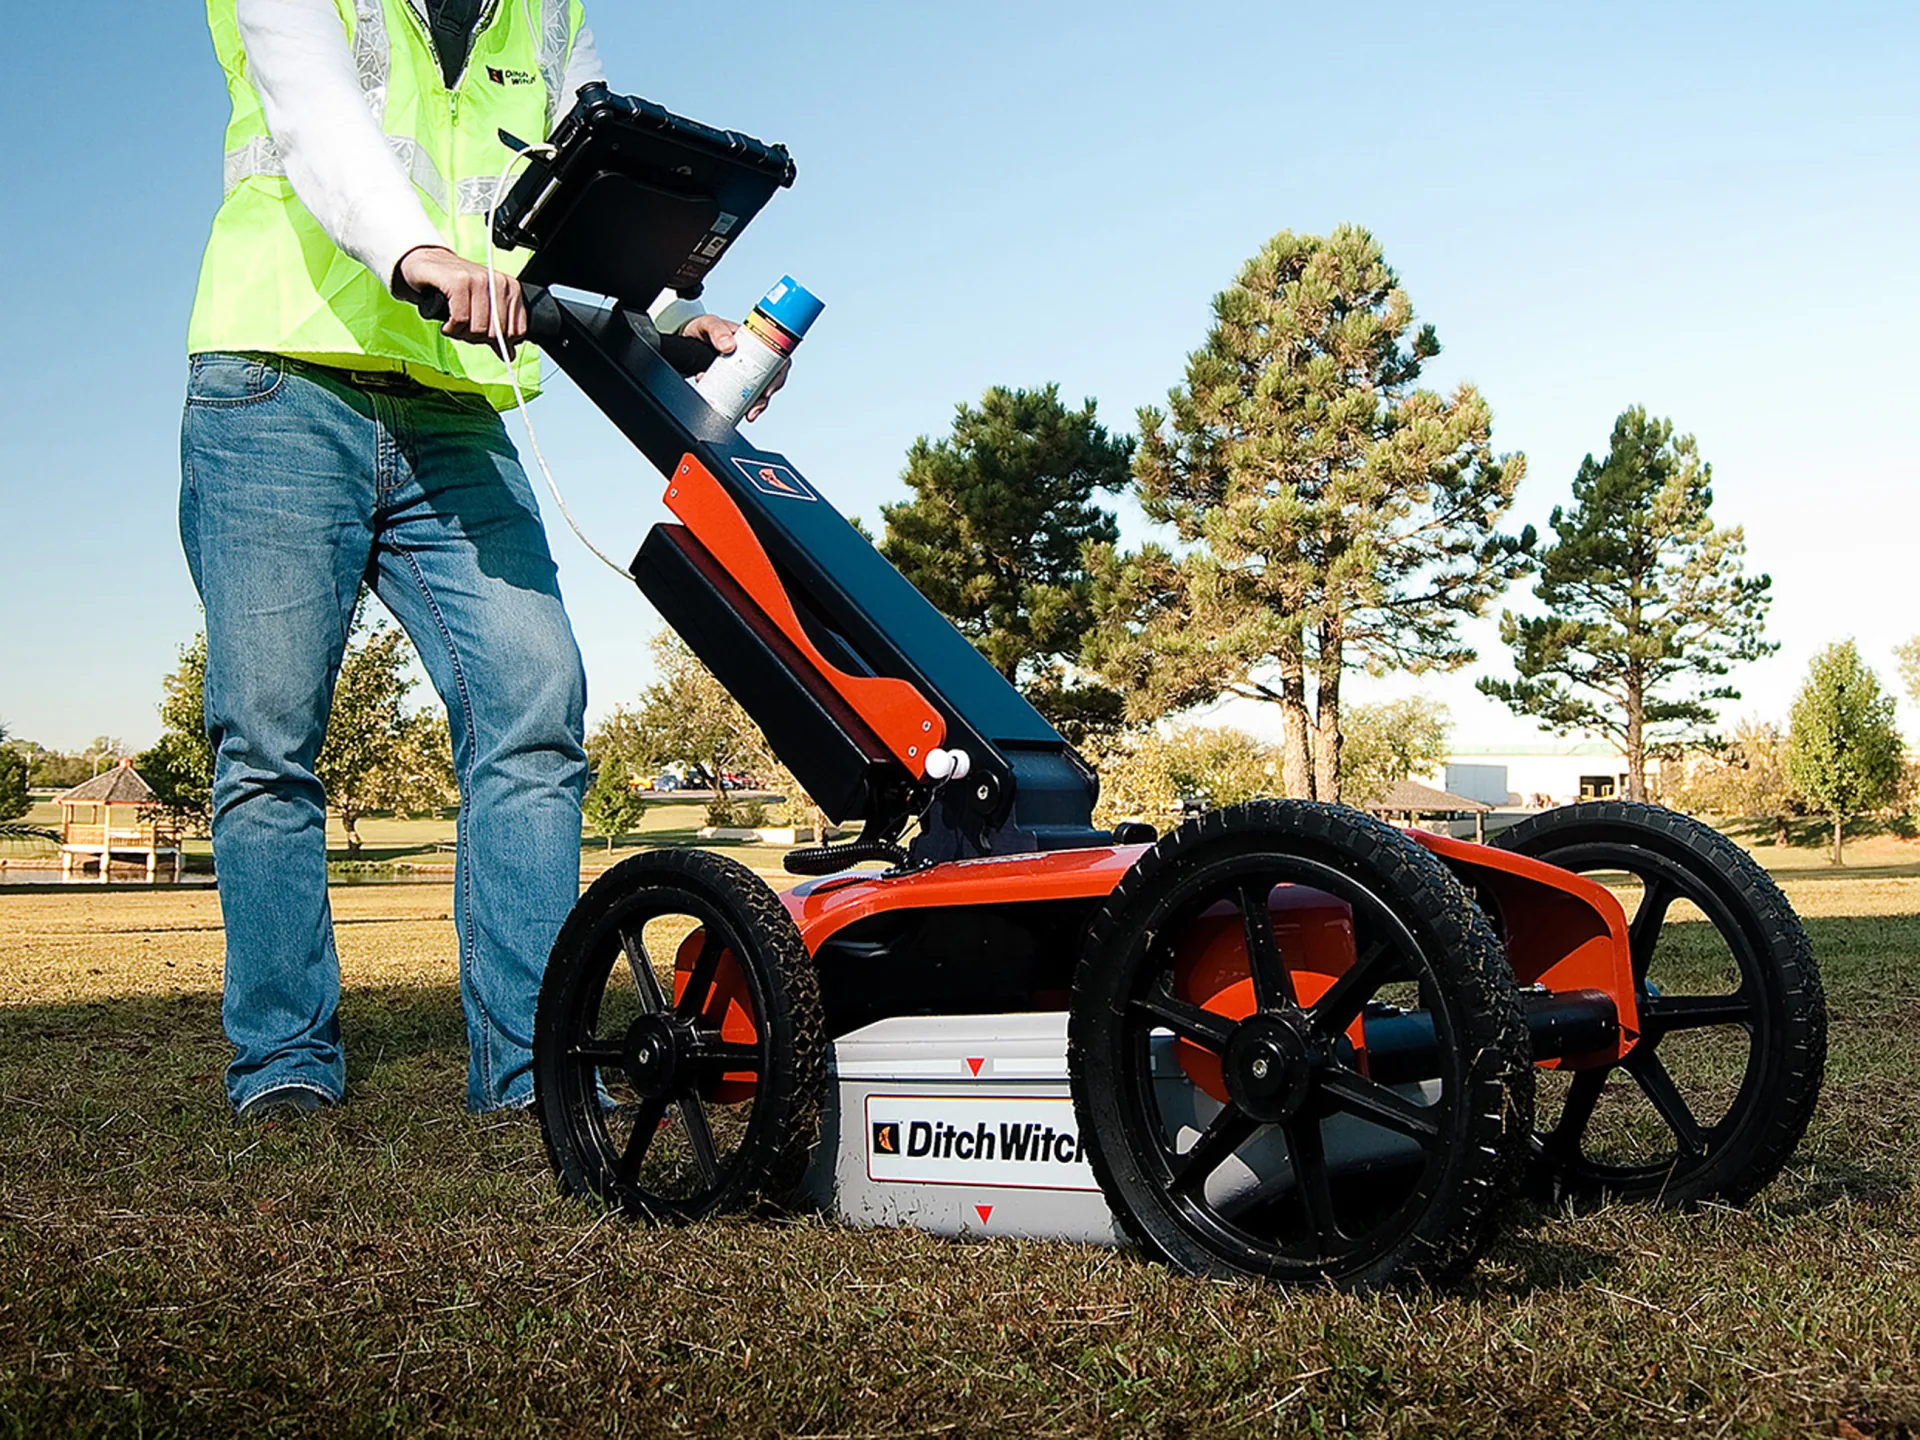
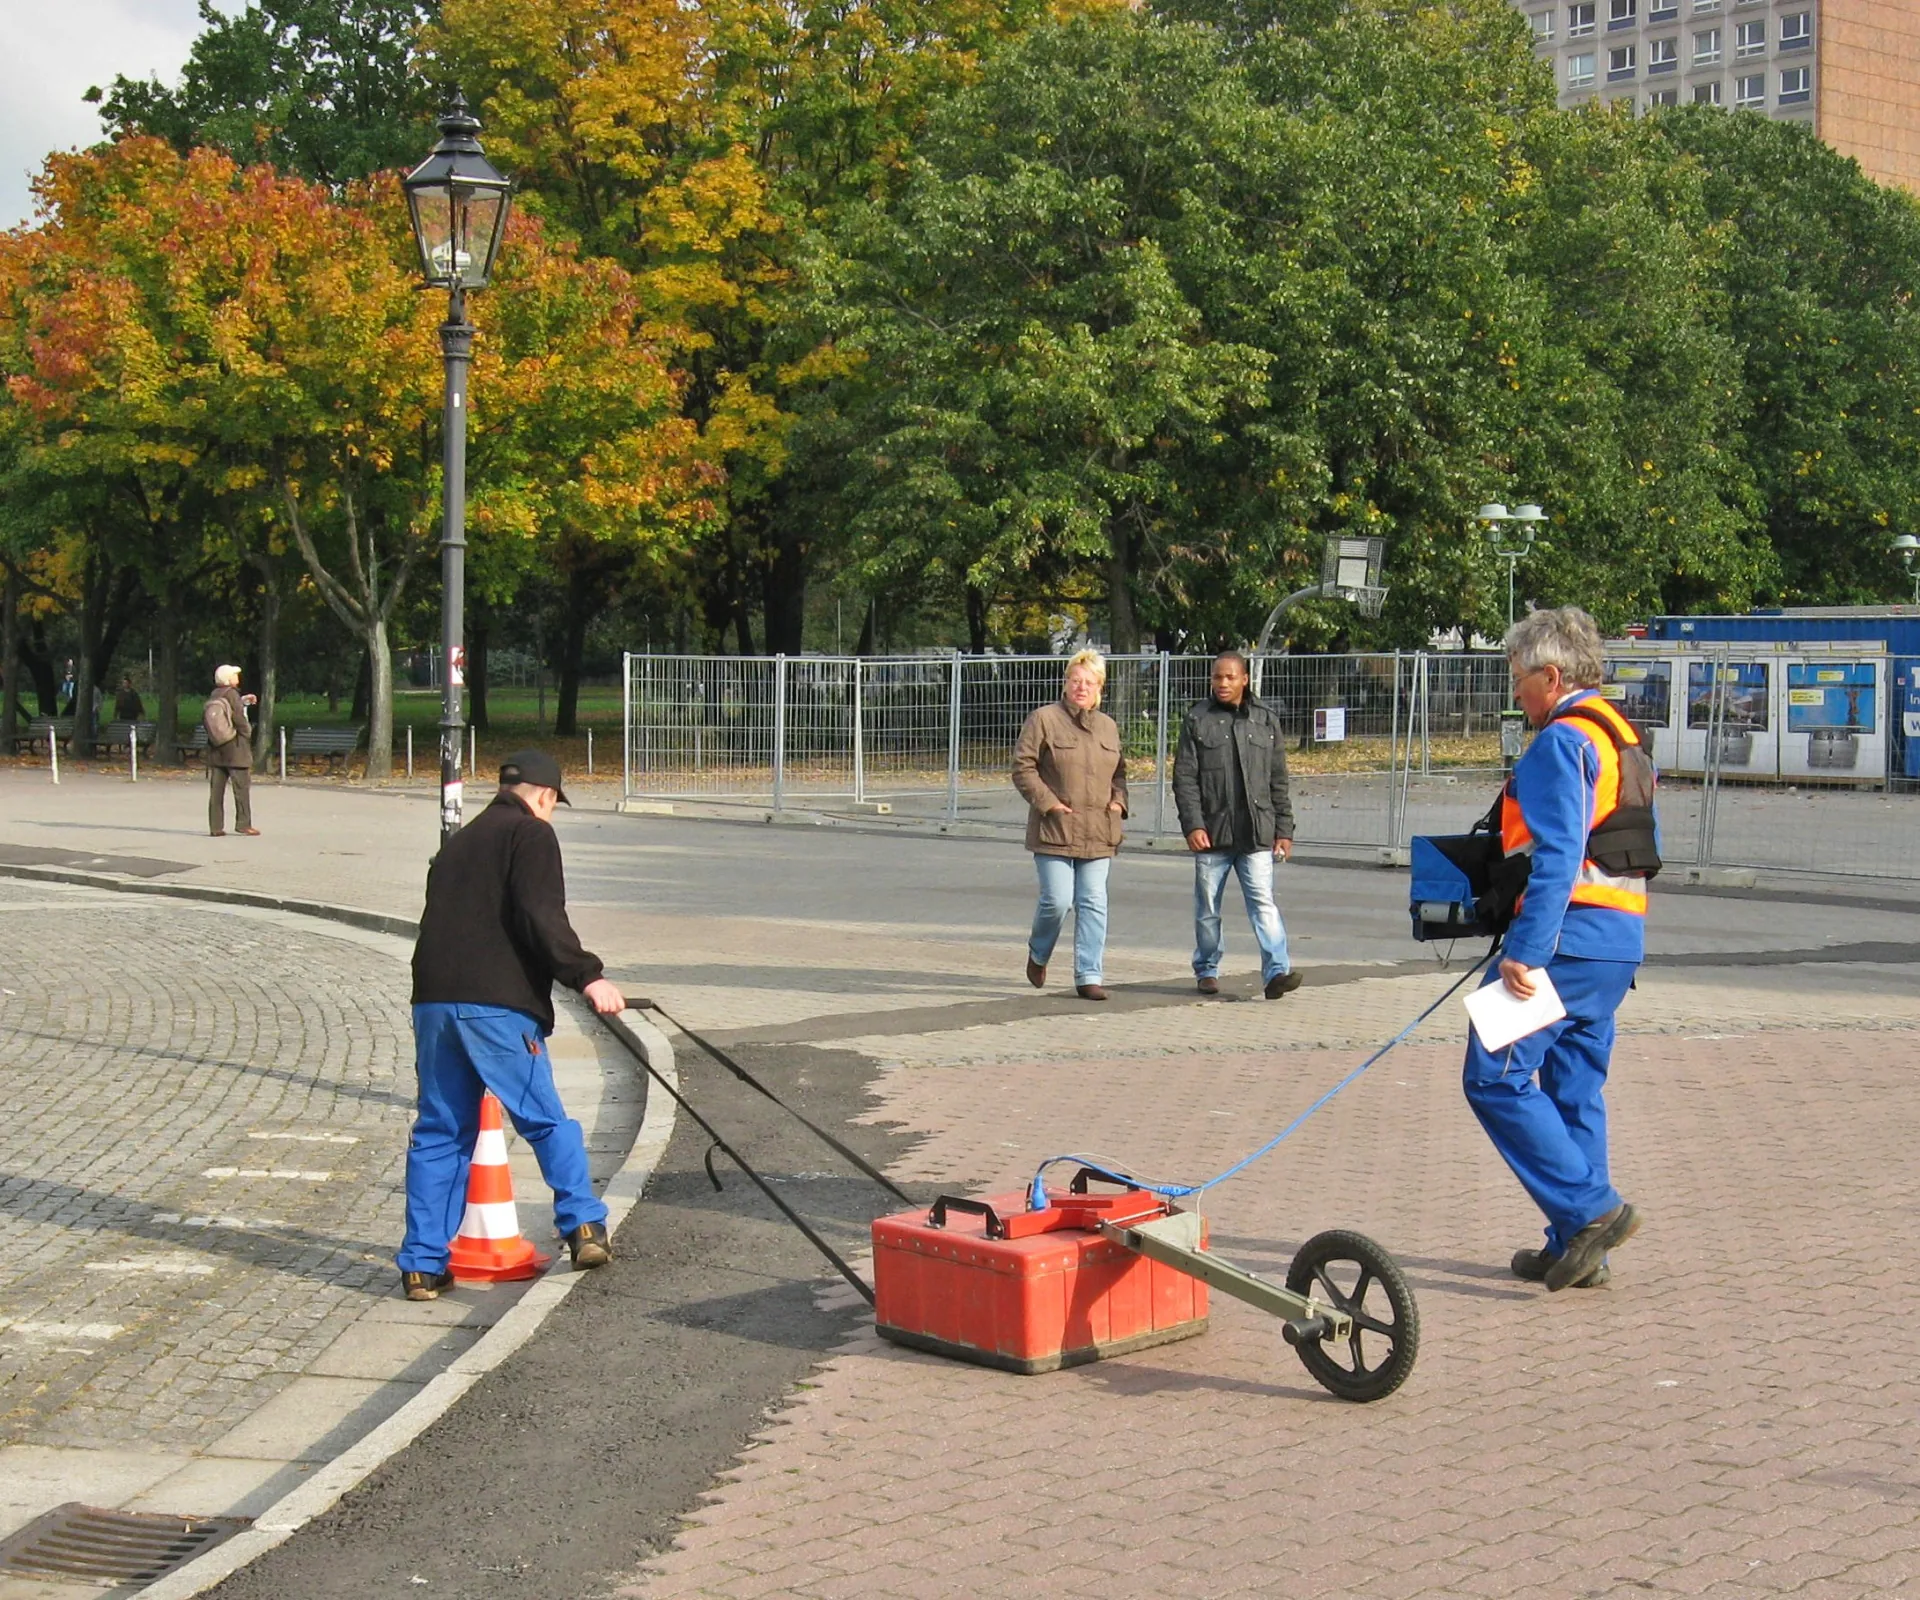
What It Is
GPR is a geophysical imaging method. Where LiDAR bounces laser light off surfaces you can see, GPR bounces radio waves off boundaries you cannot — the ones hidden underground. It is non-destructive, relatively quick, and works through soil, rock, concrete, pavement, and ice.
The output is not a photograph but a radargram: a vertical slice through the ground assembled from thousands of radar echoes. Run many lines over a grid and those slices stack into a 3D model you can cut into horizontal depth slices — the kind that reveal a buried wall or a pipe network in plan view.
How It Works
A GPR antenna rests on (or just above) the surface and emits a very short pulse of radio energy — anywhere from tens of megahertz to a few gigahertz — aimed downward. Three things then happen, over and over, hundreds of times a second:
- Transmit. The antenna sends a pulse down into the ground.
- Reflect. When the pulse reaches a boundary between materials with different electrical properties — chiefly the dielectric permittivity — part of the energy reflects back up, and the rest carries on deeper to the next boundary.
- Receive. A receiver (usually in the same housing) records each returning echo and its two-way travel time — how long the round trip took.
Wheel the antenna along a line, collect a trace every few centimeters, and stand the traces side by side: that is the radargram. Turning travel time into depth takes one more ingredient — the speed radio waves travel in the material (the velocity, set by its permittivity). That velocity is usually estimated by fitting the shape of known reflections or by referencing a target at a known depth.
GPR only sees contrast
Radar echoes come from changes in electrical properties, not from objects as such. A buried item with the same properties as the soil around it is effectively invisible, while a sharp contrast — a metal pipe in soil, an air-filled void in rock, a wet/dry boundary — reflects strongly. Good targets are ones that differ from their surroundings.
Reading a Radargram
GPR data comes in three nested forms: a single trace straight down is an A-scan; a line of traces forms the B-scan — the radargram cross-section; and a grid of lines builds a C-scan, a 3D volume you can slice into horizontal, plan-view depth maps.
The most useful thing to recognize in a radargram is the hyperbola. A small object — a pipe crossed at right angles, a rock, a cable — does not show up as a dot. As the antenna rolls toward it, the radar first “sees” it from an angle (a longer path, so a later echo); directly above, the path is shortest (the earliest echo); rolling past, the echoes grow late again. Plotted against position, that traces a downward-opening curve whose apex sits directly over the object.
Real radargrams are not photographs, and interpreting them is a skilled job: an operator has to separate genuine targets from clutter, layered “ringing,” and multiples (echoes that bounce more than once). Software and 3D collection help, but experience still matters.
Frequency, Depth & Resolution
The single most important choice in GPR is the antenna’s frequency, and it forces a trade-off you cannot escape. Low frequencies have long wavelengths that travel deep but resolve only coarse detail. High frequencies resolve fine detail near the surface but fade quickly with depth.
So you match the antenna to the job: a 100 MHz antenna to probe several meters of geology, a 1.5–2.6 GHz antenna to map rebar in the top 30 cm of a concrete slab. Many systems carry more than one antenna for exactly this reason.
Two ways to send the pulse
Most GPR is impulse (time-domain): it fires a single short, broadband pulse and times the echoes directly. A second approach, stepped-frequency (SFCW) GPR, instead sweeps a series of single tones across a band and records the amplitude and phase of each — often with a vector network analyzer — then reconstructs the time-domain response with an inverse Fourier transform. It can offer greater dynamic range and flexible bandwidth, at the cost of slower acquisition.
What Helps — and What Hurts
GPR’s reach varies enormously with the ground, and one property dominates: electrical conductivity.
Conductivity is the make-or-break
Conductive materials — wet clay, silt, saline soils, seawater — absorb radio energy quickly and can stop GPR within centimeters. Resistive, low-loss materials — dry sand, gravel, granite, concrete, ice, fresh water — let the signal travel far. The same instrument that images kilometers down through polar ice may fail in a single meter of wet clay.
Beyond the ground itself, a few limits are worth knowing:
- You need a contrast. A target that matches its surroundings electrically gives no echo (see the note above).
- Depth is only as good as your velocity. Convert travel time to depth with the wrong velocity and every depth is off; calibration against a known target matters.
- Clutter scatters the signal. Heterogeneous fill, dense rebar, cobbles, and tree roots throw back a confusing forest of reflections that can mask the target.
- Small or deep blurs out. The frequency trade-off sets a floor on how fine and how deep you can resolve at the same time.
Where GPR Is Used
Whenever you need to know what is underground without breaking it open, GPR is a first reach — especially in dry, resistive materials where it sees deepest and clearest.
Utilities & SUE
- Pipes, conduits, cables
- Finds plastic & concrete lines metal detectors miss
- Subsurface Utility Engineering
Concrete & structures
- Rebar & post-tension cables
- Slab thickness before cutting or coring
- Voids and delamination
Archaeology & forensics
- Buried walls, graves, features
- Non-destructive mapping
- Plan-view depth slices
Roads & bridges
- Pavement layer thickness
- Bridge-deck deterioration
- Asset condition surveys
Geology & groundwater
- Bedrock depth & stratigraphy
- Water table
- Void & sinkhole detection
Ice & glaciers
- Ice thickness & layering
- Crevasse detection
- GPR’s ideal medium
GPR pairs naturally with the rest of a survey toolkit: tie each reflection to a GNSS position and you can place what you find on a map, in the same coordinate system as everything else on site. Used well — the right antenna, the right ground, a careful read of the radargram — it turns the opaque earth into something you can survey.